
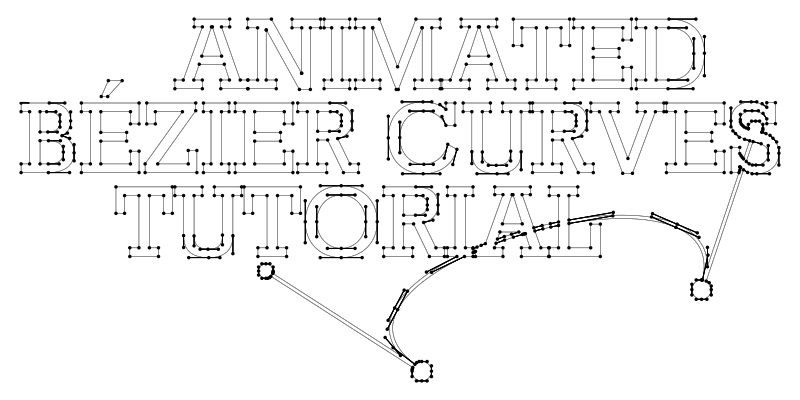
Animated Bézier Curves
In this tutorial, you will find all you need to know about Bézier
curves and information about how to calculate them yourself.
It is not as difficult as you might think.

The animation is a JavaScript driven Scaleable Vector Graphic, in short
SVG.
SVG is an XML-based vector image format for two-dimensional graphics and
supports interactivity and animation.
If you are familiar with Adobe Illustrator or the vector graphics editor
Inkscape, you can see SVG as interactive, scriptable Adbobe
Illustrator/Inkscape, which you can use in a web page. The programme
allows for interactivity and scripting, both can add a few extra
features, like the animation above, if needed.
The main benefit of SVG compared to bitmap image is the resolution
independency of SVG; you can scale an SVG without loss of quality.
Instead of using pixels SVG uses mathematical shapes like rectangle,
circle and curves - so-called Bézier curves - to describe the content.
The shapes are constructed with horizontal en vertical positions as you
will learn in this tutorial, which can easily be scaled by multiplying
these positions.
The animation above has been calculated by JavaScript in real-time on your local machine, that is when your browser supports JavaScript and SVG. Most recent browsers support both, older browsers may not. If a user has a recent browser and JavaScript is disabled manually, the animation will not be shown neither.
Bézier curves
A Bézier curve is a type of spline: a curve defined by control points.
Bézier curves are omnipresent; in computer graphics, computer-assisted
design, CAD, typography, and so on.
Two persons are associated with the Bézier curve: Paul de Casteljau and - not suprisingly - Pierre Étienne Bézier. Both worked for different French car manufactures a long time ago. The Bézier curve is obviously named after Pierre Bézier, although Paul de Casteljau worked on it earlier. His work was published at a later moment in time due to the secrecy policy of his employer.
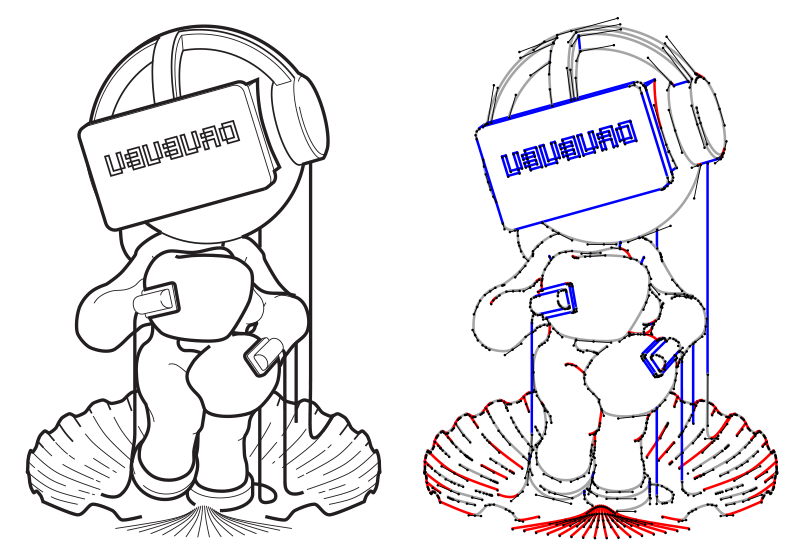
The vector illustration above is made in Adobe Illustrator. The basic building blocks of an average vector graphic are Bézier curves; you can choose between the three flavors; linear Bézier curve (the blue lines in the illustration), quadratic Bézier curve (the red lines in the illustration) or cubic Bézier curve (the grey lines in the illustration). As a user, you do not have to worry about which one to pick, the vector graphic editor decides this for you.
The black lines in the image on the right side are not visible to the user in your Vector Graphics Editor. These lines are used to position the curves and/or to influence the curvature in case of a quadratic Bézier curve or a cubic Bézier curve. If you wish to change a curve, these control points and connected lines temporary show up for the selected curve.
Terminology
A Bézier curve is defined by control points. The number of control points varies per type of Bézier curve; a linear Bézier curve, better known as a straight line, has two control points, a quadratic Bézier curve has three control points and the cubic Bézier curve has four control points.
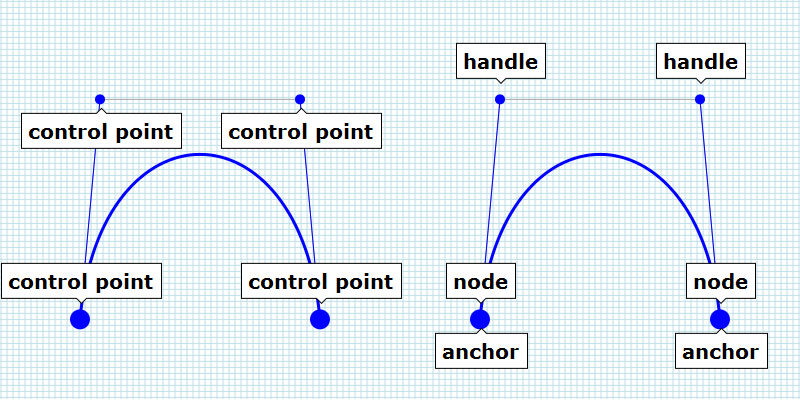
The term control point is used for all the positions of the Bézier curve
(image below left). In Adobe Illustrator, control points are subdivided
in the terms handle and anchor / anchor point (see image bottom right).
The positions which are used to influence the curvature are called
handles. The anchors describes the start and end position of a Bézier
curve.
Inkscape uses the term node where Adobe Illustrator uses the term anchor.
Linear Bézier Curve
All the positions on a linear Bézier curve can be found by using a
variable, which can vary from 0.0 to 1.0.
The variable - a container in the memory of your computer which stores a
value - may bear any name you like; t is used, lambda is used in this
tutorial, but you are free to choose any name you like, all that matters
is the value of the variable.
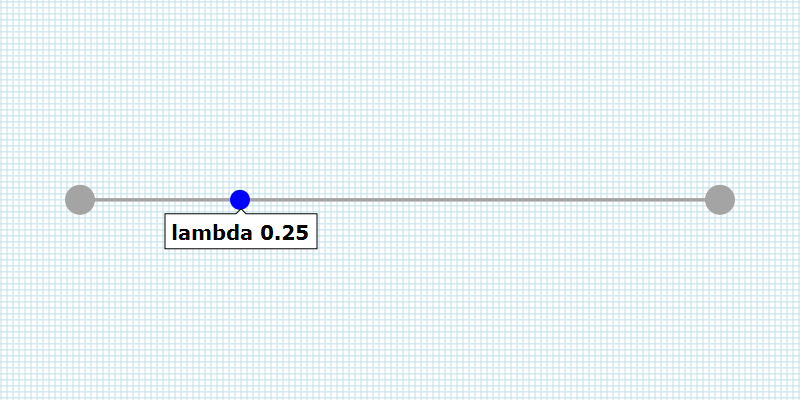
Suppose you have a linear Bézier curve - a straight line - that starts at position 10, 30 and ends at position 100, 70. To find a position on the line, you can use one of the following (interpolation) formula.
 xposition = xstart +  lambda * ( xend - xstart );
 yposition = ystart +  lambda * ( yend - ystart );

 xposition = 10.0 + 0.0 * ( 100.0 - 10.0 ); //  10.0 ( 10.0 +  0.0 )
 yposition = 30.0 + 0.0 * (  70.0 - 30.0 ); //  30.0 ( 30.0 +  0.0 )

 xposition = 10.0 + 0.5 * ( 100.0 - 10.0 ); //  55.0 ( 10.0 + 45.0 )
 yposition = 30.0 + 0.5 * (  70.0 - 30.0 ); //  50.0 ( 30.0 + 20.0 )

 xposition = 10.0 + 1.0 * ( 100.0 - 10.0 ); // 100.0 ( 10.0 + 90.0 )
 yposition = 30.0 + 1.0 * (  70.0 - 30.0 ); //  70.0 ( 30.0 + 40.0 )
If the value of the variable lambda is 0.0, the calculated position equals the start position. If lambda is 1.0 the calculated position equals the end position. All the positions between 0.0 and 1.0 describe a position on the line. e.g. the value 0.5 results in a position halfway between the start position and the end position.
Another way to find a position on the line is using the next formula.
 xposition = ( ( 1.0 - lambda ) * xstart ) + ( lambda * xend );
 yposition = ( ( 1.0 - lambda ) * ystart ) + ( lambda * yend );

 xposition = ( ( 1.0 - 0.0 ) * 10.0 ) + ( 0.0 * 100.0 ); //  10.0 ( 10.0 +   0.0 )
 yposition = ( ( 1.0 - 0.0 ) * 30.0 ) + ( 0.0 *  70.0 ); //  30.0 ( 30.0 +   0.0 )

 xposition = ( ( 1.0 - 0.5 ) * 10.0 ) + ( 0.5 * 100.0 ); //  55.0 (  5.0 +  50.0 )
 yposition = ( ( 1.0 - 0.5 ) * 30.0 ) + ( 0.5 *  70.0 ); //  50.0 ( 15.0 +  35.0 )

 xposition = ( ( 1.0 - 1.0 ) * 10.0 ) + ( 1.0 * 100.0 ); // 100.0 (  0.0 + 100.0 )
 yposition = ( ( 1.0 - 1.0 ) * 30.0 ) + ( 1.0 *  70.0 ); //  70.0 (  0.0 +  70.0 )
Notice that the result is the same. Which one you use is arbituary; choose the one which you find the most comprehensible.
Understanding the linear Bézier curve is understanding higher-order Bézier curves, like the quadratic Bézier Curve.
Quadratic Bézier Curve
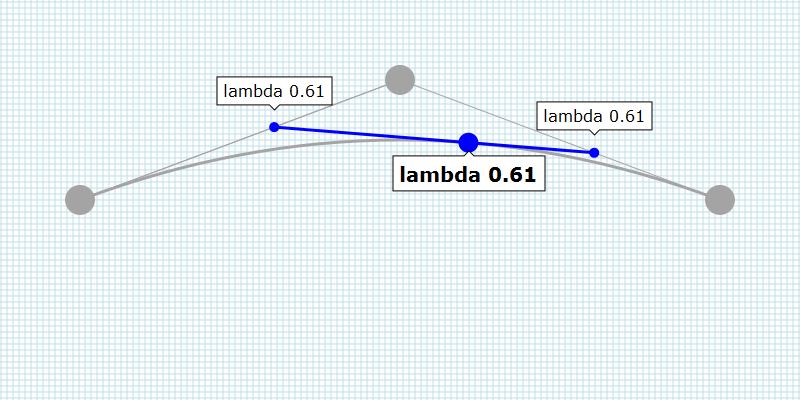
The quadratic Bézier curve consists of two linear Bézier curves. That is why it is called a higher-order Bézier curve.
Based on the value of lambda, two positions are calculated: one on each
linear Bézier curve (the blue dots in the interactive SVG below). A line
between those two positions is used to find the position we need.
The value of lambda is the same for all the lines(!)
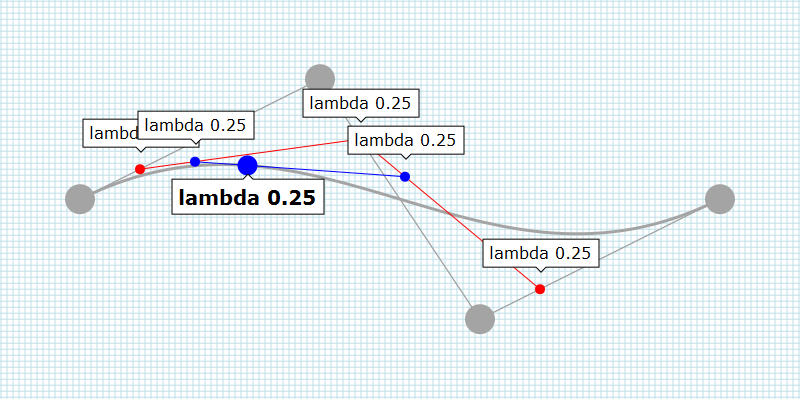
Cubic Bézier curve
The cubic Bézier curve is slightly more complicated compared to the quadratic Bézier curve.
The cubic Bézier curve consists of three linear Bézier curves.
Based on the value of lambda, three positions are calculated: one on
each linear Bézier curve (the red dots in the interactive SVG below). A
line between the first two positions is used to calculate a new
position. Then, a second line is used, one between the second and third
linear Bézier curve this time. Again a position is calculated. Finally a
line between those two newly calculated positions (the blue dots in the
interactive SVG below) is interpolated to find the position we need.
Again, the value of lambda is the same for all the lines(!)
Higher degree curves
You can use forth-order curves, curves with five, six control points, and so on... computing of theses higher degree curves is more expensive.
Animation
Now that you know how a position on the Bézier curve is calculated, you
need to know how you can animate a Bézier curve.
An animation is a sequence of images which - usually - changes over
time. The theory so far is not sufficient to create the animation on top
of this page.
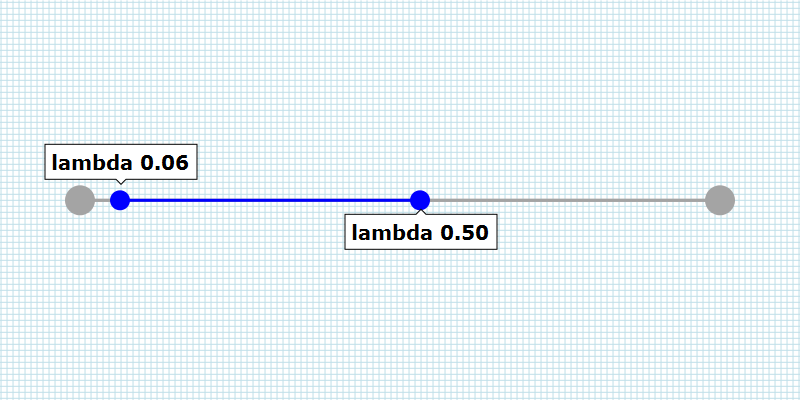
So far the interactive SVGs showed a Bézier curve which starts at 0.0
and ends at a value depending on the position of the slider. To create
an animation, the Bézier curve does not necessarily start at the
position 0.0.
To calculate a part of a Bézier curve, we need a few more calculations.
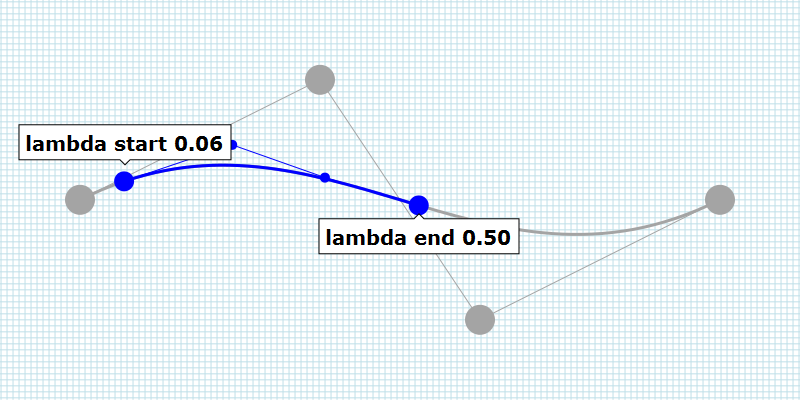
To find a part of a Bézier curve, two calculations have to be made. The
first calculation is made to determine the starting position of the
Bézier curve. The calculated Bézier curve is used as input for the
second calculation. This time, the end position of the Bézier curve is
calculated.
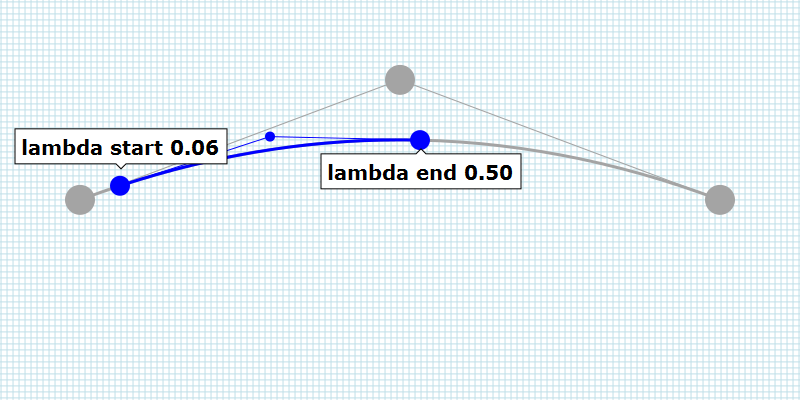
In addition to the starting and end positions, the handles have to be
calculated as well.
The newly calculated Bézier curve shows a part of the original Bézier
Curve and follows the curvature of the original Bézier curve.
By varying the value of lambda over time, the original static vector graphic can be animated.
Each type of Bézier curve requires a slightly different calculation, which is explained below, including the JavaScript required.
With some minor adjustments, you can create three-dimensional Bézier Curve. Three-dimensional Bézier curves can be used to create 3d graphics.
SVG
SVG is short for Scaleable Vector Graphics. SVG is a vector image format
for two-dimensional graphics.
SVG is XML-based. In practical terms, this means that you can open an
SVG in a text editor and read the content.
The content is a bit cryptic, but nevertheless readable.
The next block shows a very basic SVG file. You can copy and paste the code in your webpage and a red rectangle will show up. With an (external) style sheet, you can target the rectangle with the ID 'rect' and assign properties to the rectangle. In this example, inline styles are used to describe the color (fill) and stroke (stroke) properties.
 <svg viewBox="0 0 800 600" height="600px" width="800px" baseProfile="tiny" version="1.2">
  <desc>svg</desc>
  <rect id="rect" height="600" width="800" y="0" x="0" stroke="none" fill="rgb(255,0,0)"></rect>
 </svg>
Apart from a rectangle, you can use a vast number of mathematical shapes; circles, ellipses and e.g. lines.
To draw a Bézier curve, a shape called 'path' is used. A path allows you
to define a shape which has all the characteristics you like.
To describe a specific Bézier curve, all you have to do is determine the
control points of a Bézier curve.
The next three blocks of code describe a linear Bézier curves, a
quadratic Bézier curve and a cubic Bézier curve.
 <svg viewBox="0 0 800 600" width="800px" height="400px" baseProfile="tiny" version="1.2">
  <desc>linear bezier curve</desc>
  <path d="M80 200 720 200" stroke="#000000" stroke-width="2">
 </svg>
 <svg viewBox="0 0 800 600" width="800px" height="400px" baseProfile="tiny" version="1.2">
  <desc>quadratic bezier curve</desc>
  <path d="M80 200 Q400 100 720 200" stroke="#000000" stroke-width="2" fill="none">
 </svg>
 <svg viewBox="0 0 800 600" width="800px" height="400px" baseProfile="tiny" version="1.2">
  <desc>cubic bezier curve</desc>
  <path d="M80 200C200 100 600 300 720 200" stroke="#000000" stroke-width="2" fill="none">
 </svg>;
Linear Bézier Curve
 function interpolateLinearBezierCurve(
                                       lambdaStart,
                                       lambdaEnd,
                                       xAnchorStart,
                                       yAnchorStart,
                                       xAnchorEnd,
                                       yAnchorEnd
                                      ) {
  'use strict';

  var x0, y0, x1, y1, path, txt;

  if ( lambdaStart > 0.0 ) {
   xAnchorStart = xAnchorStart + lambdaStart * ( xAnchorEnd - xAnchorStart );
   yAnchorStart = yAnchorStart + lambdaStart * ( yAnchorEnd - yAnchorStart );
  }

  if ( lambdaEnd < 1.0 ) {
   xAnchorEnd = xAnchorStart + lambdaEnd * ( xAnchorEnd - xAnchorStart );
   yAnchorEnd = yAnchorStart + lambdaEnd * ( yAnchorEnd - yAnchorStart );
  }

  path = document.createElementNS( 'http://www.w3.org/2000/svg', 'path' );

  txt  = 'M' +  xAnchorStart + ' ' +  yAnchorStart;
  txt += ' ' +  xAnchorEnd + ' ' +  yAnchorEnd;

  path.setAttribute( 'd' , txt );
  path.setAttribute( 'stroke' , '#FF0000' );
  path.setAttribute( 'stroke-width' , 2.0 );

  return path;
 }
Quadratic Bézier Curve
 function interpolateQuadraticBezierCurve(
                                          lambdaStart,
                                          lambdaEnd,
                                          xAnchorStart,
                                          yAnchorStart,
                                          xHandle,
                                          yHandle,
                                          xAnchorEnd,
                                          yAnchorEnd
                                         ) {
  'use strict';

  var x0, y0, x1, y1, path, txt;

  if ( lambdaStart > 0.0 ) {
   x0 =  xAnchorStart + lambdaStart * ( xHandle    - xAnchorStart );
   y0 =  yAnchorStart + lambdaStart * ( yHandle    - yAnchorStart );
   x1 =  xHandle      + lambdaStart * ( xAnchorEnd - xHandle      );
   y1 =  yHandle      + lambdaStart * ( yAnchorEnd - yHandle      );

   xAnchorStart = x0 + lambdaStart * ( x1 - x0 );
   yAnchorStart = y0 + lambdaStart * ( y1 - y0 );
   xHandle      = x1;
   yHandle      = y1;
  }

  if ( lambdaEnd < 1.0 ) {
   x0 =  xAnchorStart + lambdaEnd * ( xHandle    - xAnchorStart );
   y0 =  yAnchorStart + lambdaEnd * ( yHandle    - yAnchorStart );
   x1 =  xHandle      + lambdaEnd * ( xAnchorEnd - xHandle      );
   y1 =  yHandle      + lambdaEnd * ( yAnchorEnd - yHandle      );

   xHandle    = x0;
   yHandle    = y0;
   xAnchorEnd = x0 + lambdaEnd * ( x1 - x0 );
   yAnchorEnd = y0 + lambdaEnd * ( y1 - y0 );
  }

  path = document.createElementNS( 'http://www.w3.org/2000/svg', 'path' );

  txt  = 'M' + xAnchorStart + ' ' + yAnchorStart + ' ';
  txt += 'Q' + xHandle      + ' ' + yHandle      + ' ';
  txt +=       xAnchorEnd   + ' ' + yAnchorEnd;

  path.setAttribute( 'd' , txt );
  path.setAttribute( 'stroke' , '#00FF00' );
  path.setAttribute( 'stroke-width' , 2.0 );
  path.setAttribute( 'fill' , 'none' );

  return path;
 }
Cubic Bézier Curve
 function interpolateCubicBezierCurve(
                                      lambdaStart,
                                      lambdaEnd,
                                      xAnchorStart,
                                      yAnchorStart,
                                      xHandleStart,
                                      yHandleStart,
                                      xHandleEnd,
                                      yHandleEnd,
                                      xAnchorEnd,
                                      yAnchorEnd
                                    ) {
  'use strict';

  var x0, y0, x1, y1, x2, y2, x3, y3, x4, y4, path, txt;

  if (lambdaStart > 0.0) {
   x0 = xAnchorStart + lambdaStart * ( xHandleStart - xAnchorStart );
   y0 = yAnchorStart + lambdaStart * ( yHandleStart - yAnchorStart );
   x1 = xHandleStart + lambdaStart * ( xHandleEnd   - xHandleStart );
   y1 = yHandleStart + lambdaStart * ( yHandleEnd   - yHandleStart );
   x2 = xHandleEnd   + lambdaStart * ( xAnchorEnd   - xHandleEnd   );
   y2 = yHandleEnd   + lambdaStart * ( yAnchorEnd   - yHandleEnd   );

   x3 = x0 + lambdaStart * ( x1 - x0 );
   y3 = y0 + lambdaStart * ( y1 - y0 );
   x4 = x1 + lambdaStart * ( x2 - x1 );
   y4 = y1 + lambdaStart * ( y2 - y1 );

   xAnchorStart = x3 + lambdaStart * ( x4 - x3 );
   yAnchorStart = y3 + lambdaStart * ( y4 - y3 );
   xHandleStart = x4;
   yHandleStart = y4;
   xHandleEnd   = x2;
   yHandleEnd   = y2;
  }

  if ( lambdaEnd < 1.0 ) {
   x0 = xAnchorStart + lambdaEnd * ( xHandleStart - xAnchorStart );
   y0 = yAnchorStart + lambdaEnd * ( yHandleStart - yAnchorStart );
   x1 = xHandleStart + lambdaEnd * ( xHandleEnd   - xHandleStart );
   y1 = yHandleStart + lambdaEnd * ( yHandleEnd   - yHandleStart );
   x2 = xHandleEnd   + lambdaEnd * ( xAnchorEnd   - xHandleEnd   );
   y2 = yHandleEnd   + lambdaEnd * ( yAnchorEnd   - yHandleEnd   );

   x3 = x0 + lambdaEnd * ( x1 - x0 );
   y3 = y0 + lambdaEnd * ( y1 - y0 );
   x4 = x1 + lambdaEnd * ( x2 - x1 );
   y4 = y1 + lambdaEnd * ( y2 - y1 );

   xHandleStart = x0;
   yHandleStart = y0;
   xHandleEnd   = x3;
   yHandleEnd   = y3;
   xAnchorEnd   = x3 + lambdaEnd * ( x4 - x3 );
   yAnchorEnd   = y3 + lambdaEnd * ( y4 - y3 );
  }

  path = document.createElementNS( 'http://www.w3.org/2000/svg', 'path' );

  txt  = 'M' +  xAnchorStart + ' ' +  yAnchorStart;
  txt += 'C' +  xHandleStart + ' ' +  yHandleStart;
  txt += ' ' +  xHandleEnd   + ' ' +  yHandleEnd  ;
  txt += ' ' +  xAnchorEnd   + ' ' +  yAnchorEnd;

  path.setAttribute( 'd' , txt );
  path.setAttribute( 'stroke' , '#0000FF' );
  path.setAttribute( 'stroke-width' , 2.0 );
  path.setAttribute( 'fill' , 'none' );

  return path;
 }